Tone Combination

Tone combinations
| Play Tone 1 alone |
Play Tone 2 alone |
Play Tone 3 alone |
| Play Tones 1 and 2 together |
Play Tones 1 and 3 together |
Play Tones 2 and 3 together |
Natural and Sinewave Speech
| Play Sinewave |
Play Natural |
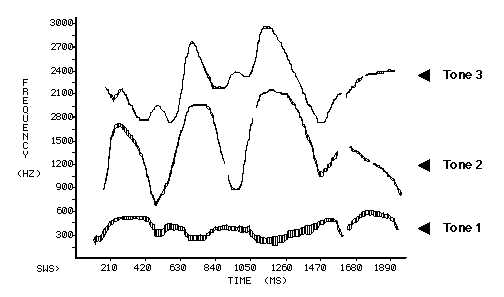
The picture above is a display of the parameters used by the Haskins SineWave Synthesizer (SWS) in experiments that study the temporal aspects of speech.
The horizontal axis shows time in milliseconds; the vertical axis shows frequency in Hz. The pattern is a graph of frequency and amplitude variations of three sinusoids. Height in the plane indicates frequency; the thickness of each tracing indicates amplitude.
The properties of tonal analogs of speech vary over time. Accordingly, the tones rise and fall in frequency and amplitude in imitation of the frequency and amplitude variations of vocal resonances over the course of an utterance.
Note however, that unlike the natural speech signal, sinewave speech does not have the normal structure -- there are no broadband formants; there is no regularly pulsed source; the normal short-time "cues" found in speech signals are missing; etc. What remains are just 3 (or sometimes 4) rapidly changing pure tones.
For most listeners, these signals are sufficient to convey a phonetic message (that is, listeners hear them as speech and can identify the individual speech sounds). Why? The pattern of variation imposed on the sinusoidal carriers is sufficient information for the perception of phonetic attributes despite the elimination of natural acoustic elements. This reveals that perception is sensitive to information carried by patterns of stimulation independent of the elements composing the pattern.